This spreadsheet builds on the work of Dr. Kyla Terhune (DIO at Vanderbilt University Medical Center) and was developed by Daniel Kendrick MD MA, Laura Mazer MD MHPE, Sean Loiselle, Tanvi Gupta, Dr. Hoda Bandeh-Ahmadi, Kenneth Abbott, Brian George MD MA and others at the University of Michigan.
Instructions
Please note: If you encounter any problems with this tool or have suggestions for its improvement, please reach out to info@covidstaffing.org.
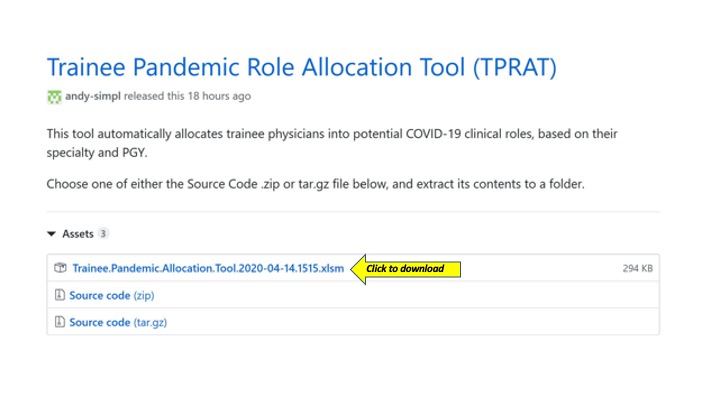
Step 1: Download the Trainee Pandemic Role Allocation Tool file.
Click on the above link, which will take you to a code repository site.
Scroll down to “Assets” and click the .xlsm (Excel) file to download it. Save the file to your desktop.
Step 2: Click to open the Microsoft Excel file on your desktop; you will need to click “Enable Macros” when prompted.

When you open the file, you will see 7 worksheets:

Worksheet 2 (“Trainee Data”) will ask you to input your institutional data (which the steps below will walk you through). Worksheets 3 and 4 are your results, and worksheets 5-7 are appendices that illustrate the taxonomies and coding from which this tool was built.
Step 3: Download your institutional trainee data.
Have your DIO log into the ACGME’s WebADS website (at acgme.org) to download your institution’s data. Once the DIO has signed into WebADS, they should select the “Reports” tab at the top right:

From here the DIO can select “Resident Data: Download My Residents Data:”

Step 4: Copy institutional trainee data from the ACGME spreadsheet.
Your DIO should delete all columns except for the two named “Program Specialty” and “Year in Program.” Copy the columns labeled “Program Specialty” and “Year in Program” (command + C for Macs; control + C for PCs).
Step 5: Paste your institutional trainee data into the TPRAT.
Click on the second worksheet in the TPRAT Excel document, “Trainee Data.”
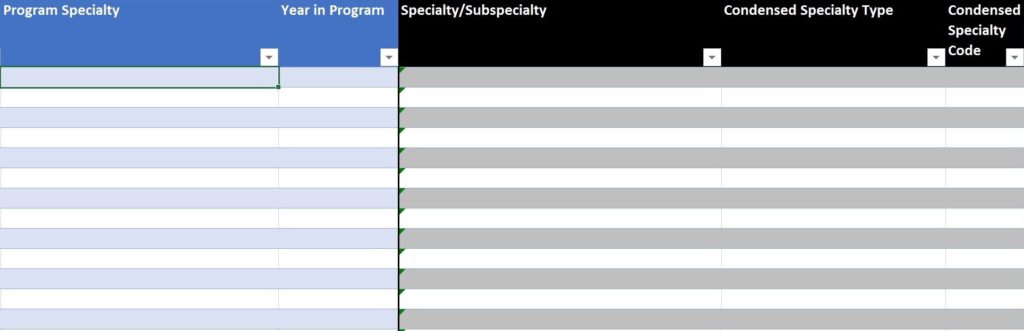
Paste the ACGME “Year in Program” data into Column C. Then, paste the ACGME “Program Specialty” data into Column D.
If this data input is successful, you will see Column F and Column G of the “Trainee Data” worksheet automatically populate with a Condensed Specialty category and a code for every row:
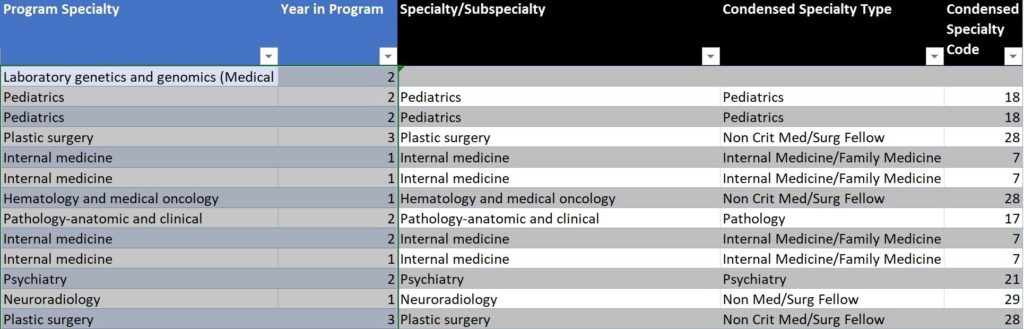
If it doesn’t populate, double check that you haven’t accidentally placed the “year” data into the wrong column, or vice versa.
Contact info@covidstaffing.org with any problems; we are here to help.
Please note: While the ACGME WebADS report will give you much of your trainee data, some specialties are not accredited by ACGME and will therefore still be missing. There is also the possibility that our tool is missing an ACGME-accredited specialty. In those cases, please let us know by emailing info@covidstaffing.org with the missing ACGME-accredited specialty so that we can add it to the TPRAT.
Step 6: View your results.
Click on the third worksheet in the TPRAT Excel document, “Roles.” Click on the orange “Click to Update” button to populate the cells in this worksheet based on your institutional trainee data. This may take a minute or more to run.
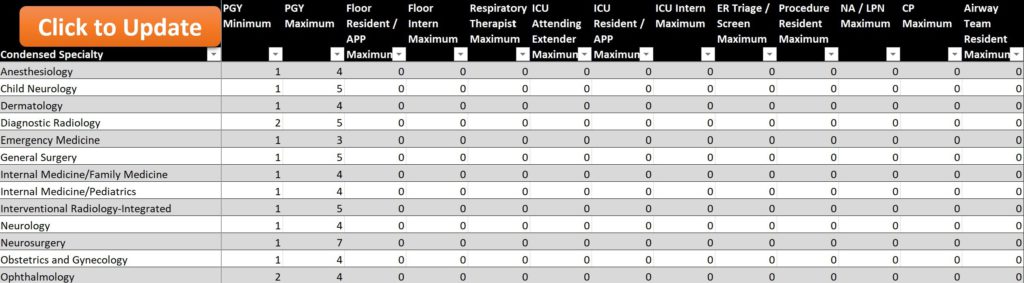
This worksheet illustrates how many residents, per specialty, are available for certain COVID response roles.
You will see a list of specialties in the Column 1 and a list of COVID-related clinical roles in the column headers. Columns 2 and 3, “PGY Minimum” and “PGY Maximum,” are the first and last years of training specific to that specialty. The rest of the columns are the numbers of trainees, per specialty, that your institution has available to fill the COVID-specific roles. Along the bottom of the tables are totals. For descriptions of these roles, refer to worksheet 8 (“Appendix – Response Roles“).
Click on the fourth worksheet in the TPRAT Excel document, “Roles by PGY.” This worksheet illustrates how many residents, per specialty and PGY year, are available for specific COVID response roles.
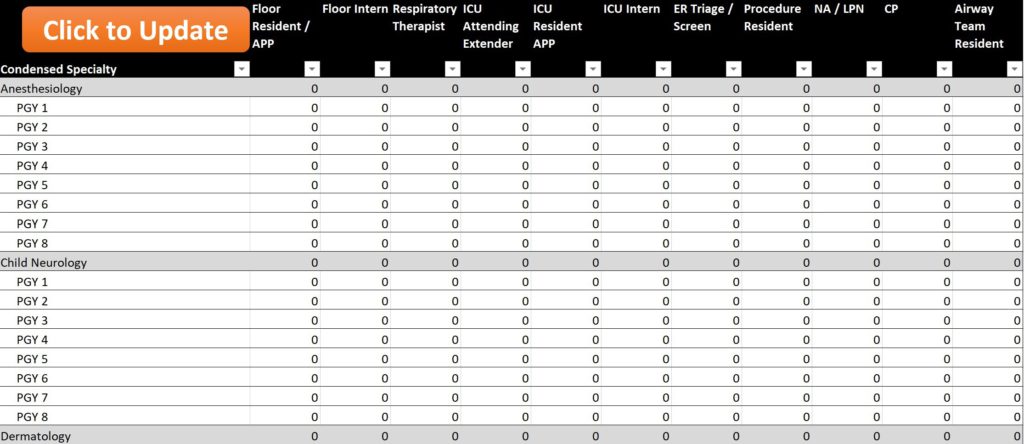
This worksheet will be already populated based on your institutional trainee data. You will see a list of specialties and PGY levels in column 1 and a list of COVID-related clinical roles in the rest of the columns. Along the bottom of the tables are totals.